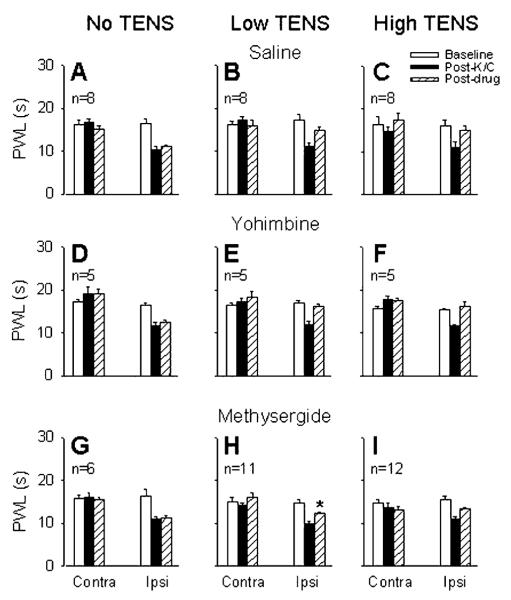
Fig. 1.
Bar graphs show the PWLs before (open bars), after joint inflammation (solid bars) and after treatment with drug and TENS/no TENS (hatched bars) for the ipsilateral and contralateral paws. Effects of intrathecal yohimbine and methysergide on carrageenan-induced hyper-algesia compared to saline control are shown in the graphs on the left panel (no TENS; graphs A, D, G). Effects of intrathecal saline, yohimbine or methysergide on low frequency TENS antihyperalgesia are shown in the middle panel (low TENS; graphs B, E, H), and effects of saline, yohimbine (30 μg) or methysergide (30 μg) on high frequency TENS are shown in the right panel (high TENS; graphs C, F, I). *, Significantly different from vehicle control group and also from its own baseline. K/C, kaolin and carrageenan; Contra, contralateral; Ipsi, ipsilateral.

