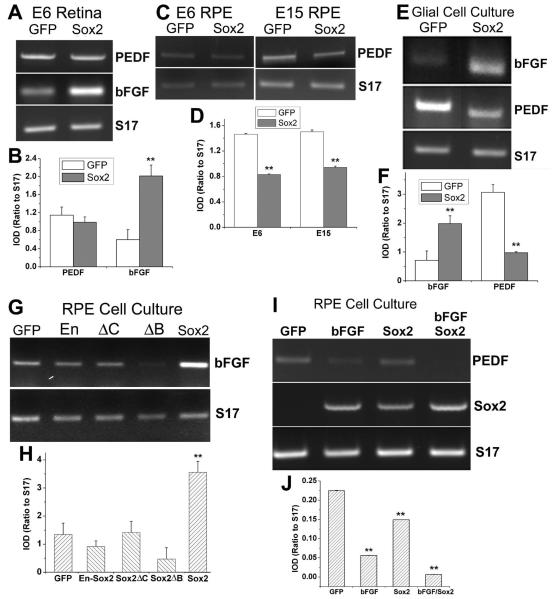
Fig. 7.
Increasing bFGF expression and decreasing PEDF expression by Sox2. A: RT-PCR analysis of bFGF and PEDF expression in E6 retina infected with RCAS-GFP (GFP) or RCAS-Sox2 (Sox2). Housekeeping gene S17 was used as an internal control of the relative amount of cDNA present in each sample. B: A plot of IOD ratios (to S17) of the DNA band intensities of PEDF and bFGF PCR products. C, D: RT-PCR and a plot of IOD ratios (to S17) of PEDF expression in E6 and E15 RPE infected RCAS-GFP (GFP) or RCAS-Sox2 (Sox2). E, F: RT-PCR and a plot of IOD ratios (to S17) of bFGF expression and PEDF expression in glial cell culture infected with RCAS-GFP (GFP) or RCAS-Sox2. G, H: RT-PCR and a plot of IOD ratios (to S17) of bFGF expression E6 RPE cell culture infected with RCAS-GFP (GFP), RCAS-Sox2ΔB, RCAS-Sox2ΔC, RCAS-En-Sox2, or RCAS-Sox2. I, J: RT-PCR and a plot of IOD ratios (to S17) of the expression of PEDF and Sox2 in RPE cell cultures infected with RCAS-GFP (GFP), treated with bFGF (bFGF), infected with RCAS-Sox2 (Sox2), or treated with bFGF as well as infected with RCAS-Sox2 (bFGF Sox2). Bars shown in all plots are the means and S.D.s from 3 independent RT-PCR reactions. “*” indicates statistically significant at p<0.05 level, and “**” at p<0.01 level.

