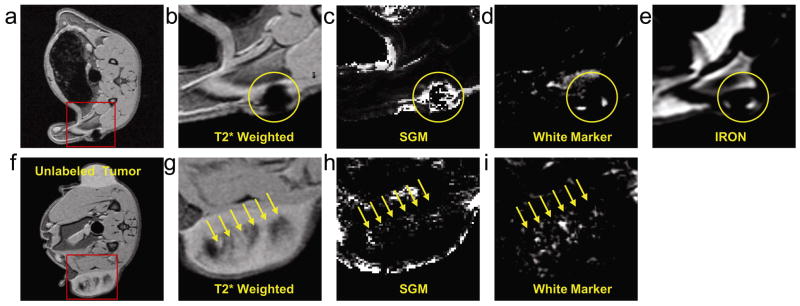
Figure 4.
Top row: Images were acquired when the SPIO labeled tumor was approximately 5 mm in diameter, representing highly concentrated SPIO labeled tumor cells (yellow circle). An axial slice of the rat (a) and zoom views of the labeled tumor with T2* weighted (b), SGM (c), White Marker (d) and IRON (e) techniques. Bottom row: Images were acquired when the SPIO labeled tumor was approximately 20 mm in diameter, representing diluted SPIO nanoparticles (yellow arrow). An axial slice of the rat (f) and zoom views of the labeled tumor with T2* weighted (g), SGM (h), White Marker (i) techniques. The IRON technique failed to generate positive contrast images of the diluted SPIO nanoparticles.

