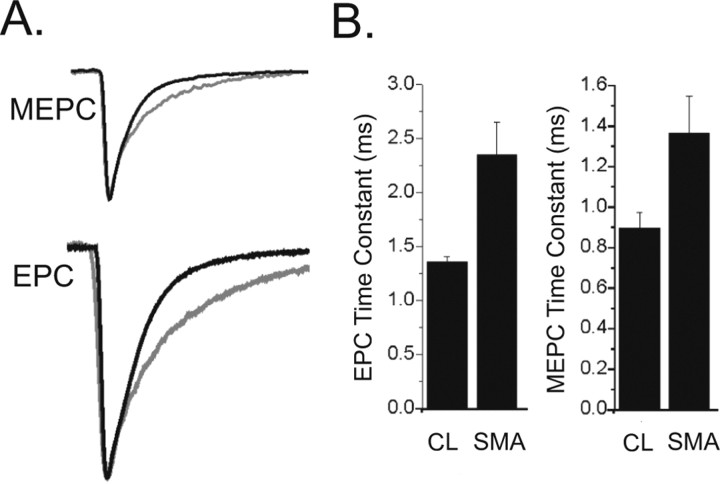
Figure 6.
EPC and MEPC decay time constants are prolonged in NMJs from SMA mice. A, The CL and SMA MEPCs and EPCs from Figures 2 and 3 have been normalized and aligned by their peaks to allow for comparison of rates of decay. The MEPC and EPC from the SMA pups are gray and have slower rates of decay. B, Shown are bar graphs of the average EPC decay (*p = 0.02) and MEPC decay (p = 0.06) in CL and SMA NMJs.

