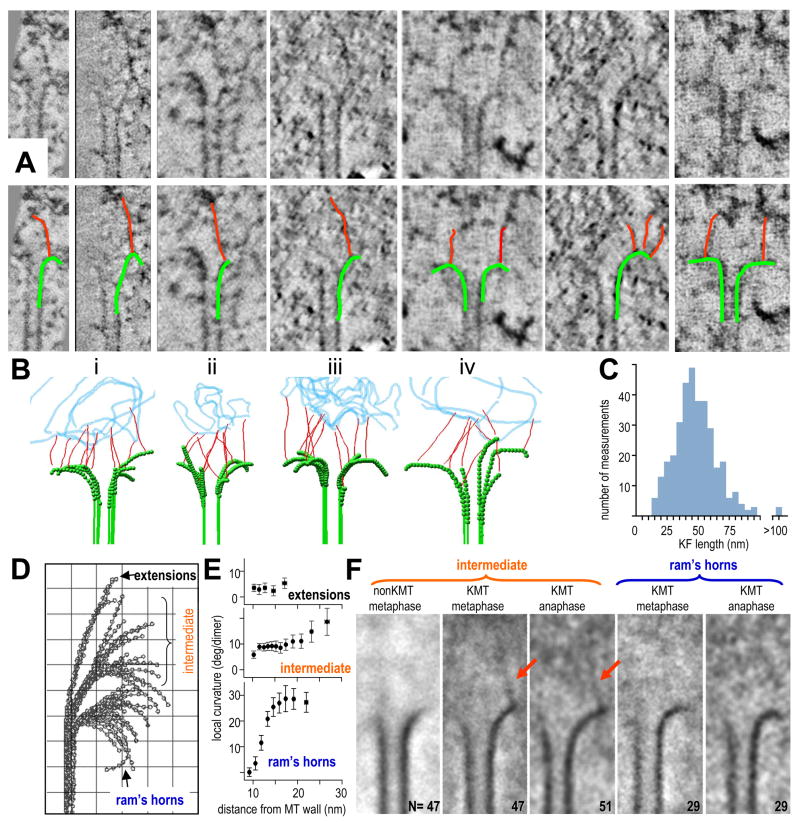
Figure 4. Fibrils associate with PFs at places that correlate with changes in local PF curvature.
A. Tomographic slices of KMT ends. The same gallery is also shown with PFs and their associated KFs indicated by graphic overlays.
B. Models of metaphase (i,ii) and anaphase (iii,iv) KMT ends; PFs traced in green, KFs in red; a representation of chromatin is in blue.
C. Histogram of KF lengths based on data from 40 KMTs chosen at random from 4 cells.
D,E. PFs from all the KMTs reconstructed by electron tomography from one metaphase kinetochore. PFs were grouped by their orientation angles. Mean local curvatures of each group are plotted in (E). The intermediate group of PFs is conspicuous for its consistent local curvature near the MT wall and its curvature variation farther from the wall. Grid=10nm.
F. Averages of multiple tomographic slices containing PFs from different groups (numbers as indicated). Alignments maximized overlap for the PFs curving right. Intermediate group PFs from metaphase non-KMTs average well, but no KF is evident. Intermediate group KMT PFs from one metaphase and one anaphase cell show 45 – 54 nm KFs, attached to the averaged PF and extending toward the chromatin. Averages of the ram’s-horn groups from metaphase and anaphase cells showed no additional electron density at PF tips.

