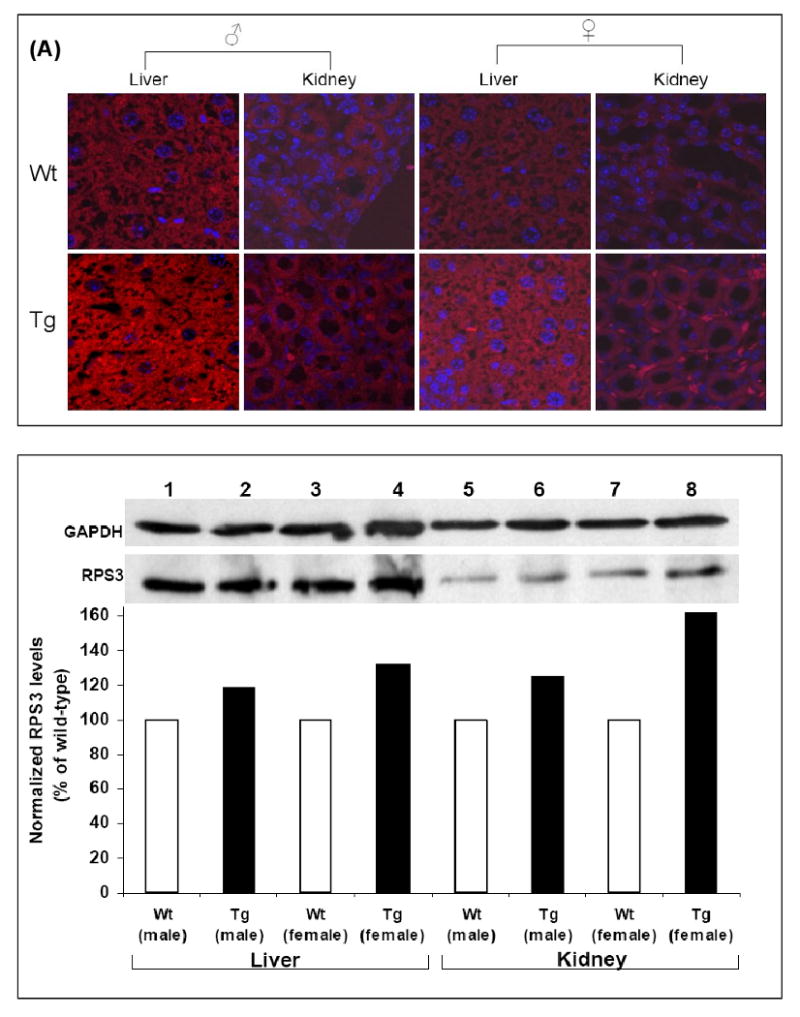
Figure 1. Expression analysis of RPS3.

(A) Human RPS3 levels were analyzed in tissues from wild-type and transgenic mice by laser scanning confocal microscopy after staining with custom made RPS3 primary antibody and rodamine red tagged anti-rabbit secondary antibody. Nuclei were stained by DAPI. A representative image of immunofluorescence detection of RPS3 over expression in liver and kidney of male and female transgenic as well as wild-type mice is shown. (B) Over expression of RPS3 in liver and kidney of transgenic male and female mice was also determined by immobilizing an aliquot (20 μg) of protein extract from each tissue by SDS-PAGE. After immunoblotting using anti-RPS3 and anti-GAPDH antibodies the levels of RPS3 were evaluated from integrated density values (IDV), obtained by densitometry tracing of each band. Each RPS3 band was normalized by dividing the IDV of a protein band by the IDV of the GAPDH within the same sample. The normalized IDV values for wild-type was set as 100% and over expression of RPS3 was determined as a percent of wild-type for each tissue.
