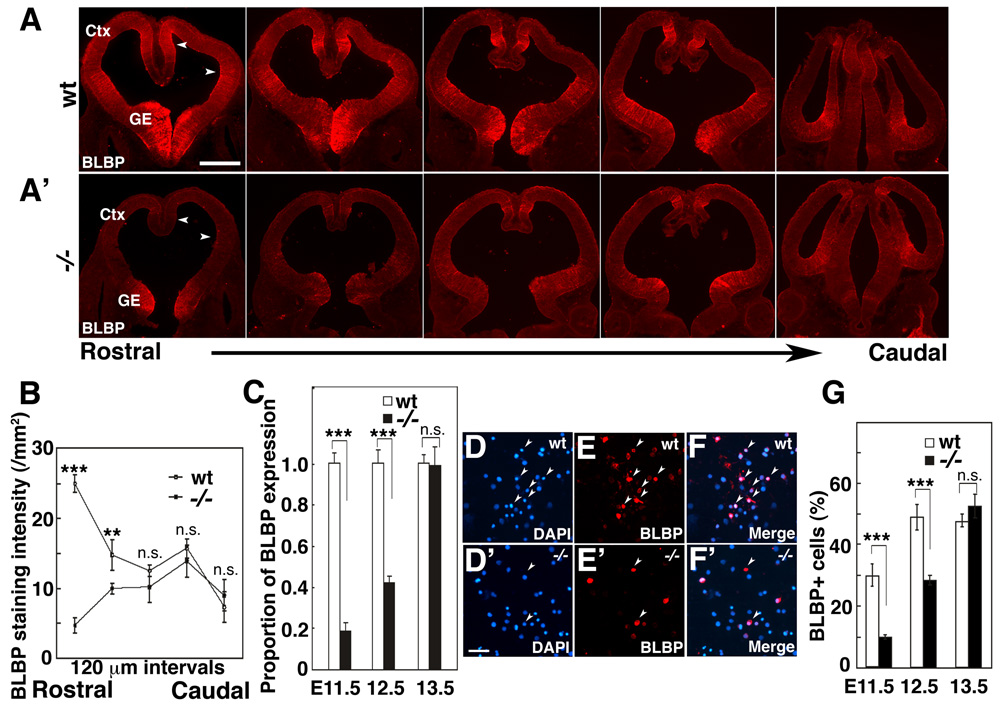
Figure 4. Loss of Fgf10 delays radial glia differentiation preferentially in rostral cortex.
(A,A’) BLBP immunostaining of series of coronal sections along rostral-caudal axis of wt (wt) (A) and Fgf10 −/− cortex (A’). (B) Quantification of BLBP staining intensity of wt and Fgf10−/− cortices (n=4); mean ± s.e.m. is plotted at 120 µm intervals along the rostral-caudal cortical axis. BLBP staining is significantly diminished in rostral sections of Fgf10 −/− cortex compared to wt, but staining is comparable in caudal sections (also compare A to A’) (Actual data for each plotted point in B, Rostral to Caudal and signifcanace, unpaired Student’s t-test: wt 24.8 ± 2.3, KO 4.8 1.8, p<0.001; wt 14.8 ± 3.5, 9.9 ± 1.1, p< 0.01; 12.9 ± 1.4, 10.2 ± 3.4, n.s.; 16.7 ± 2.1, 13.8 ± 2.9, n.s.; 8.2 ± 3.4, 7.2 ± 3.0, n.s.) (C) Fluorescence intensity of BLBP staining in rostral cortex at E11.5, E12.5 and E13.5 in wt and Fgf10 −/− mice (n=4, 1.0 ± 0.051 s.e.m. at E11.5,1.0 ± 0.064 s.e.m. at E12.5, 1.0 ± 0.041 s.e.m. at E13.5 for wt, and 0.18 ± 0.038 s.e.m. at E11.5, 0.48 ± 0.028 s.e.m. at E12.5, 0.99 ± 0.09 s.e.m. at E13.5 for Fgf10 −/−, respectively. Significance between wt and Fgf10 −/−mice in unpaired Student’s test is p<0.001 at E11.5, p<0.001 at E12.5, and n.s. at E13.5). The difference in BLBP expression between wt and Fgf10 −/− rostral cortex is substantial at E11.5 and E12.5, but is indistinguishable at E13.5; thus, the delay in upregulation of BLBP expression in Fgf10 −/− cortex is transient. (D–F) Quantification of BLBP positive cells in rostral cortex of wt or Fgf10 −/− littermates. Dissociated cells from E11.5 rostral cortex of wt (D, E, F) or Fgf10 −/− (D’, E’, F’) were immunostained by BLBP antibody (E, E’) and counterstained with DAPI (D, D’). Merged images are shown in F and F’. (G) Total cells of E11.5, E12.5 and E13.5 stained by DAPI and positive cells for BLBP staining were counted, respectively (three independent experiments, 10 fields examined per experiment, 29.7 ± 3.6% s.e.m. at E11.5, 48.8 ± 4.0 % s.e.m. at E12.5, 69.5 ± 2.9 % s.e.m. at E13.5 for wt, 9.7 ± 0.8 % s.e.m. at E11.5, 28.2 ± 1.6 % s.e.m. at E12.5, 64.0 ± 2.3 % s.e.m. at E13.5 for Fgf10 −/−, respectively. Significance between wt and Fgf10−/− mice in unpaired Student’s test is p<0.001 at E11.5, p<0.001 at E12.5, and n.s. at E13.5). Scale bar: 0.5mm (A–E”), 0.1mm (D–F’). Ctx: cortex, GE: ganglionic eminence.

