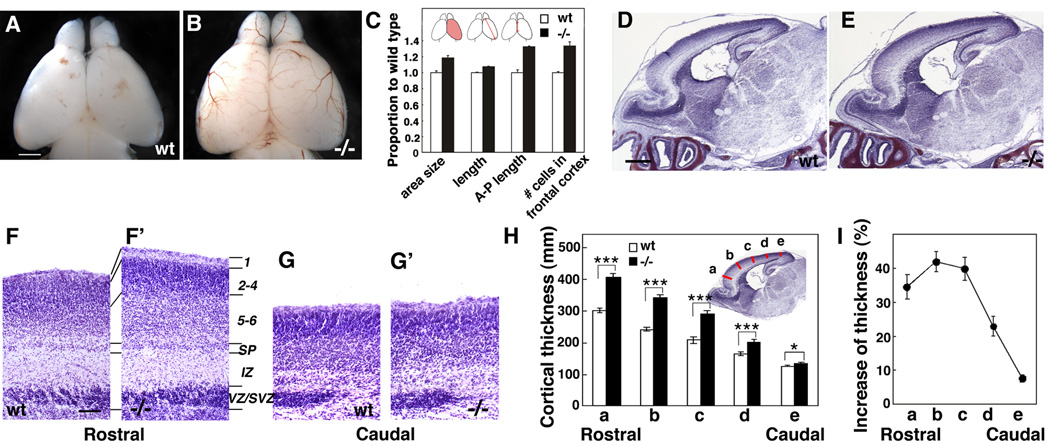
Figure 8. Fgf10 −/− mice exhibit overall increase in cortical surface area and increased laminar thickness preferentially in rostral cortex.
(A, B) Dorsal views of P0 brains of wt (A) and Fgf10−/− mice (B). (C) Quantitative comparison of brain size between wt (n=4) and Fgf10 −/− mice (n=4) at P0. Area size: dorsal cortical surface area is 18.6 ± 2.93 % greater in Fgf10 −/− than wt; length from the top of the rostral pole to the caudolateral pole is 7.3% ± 0.88% greater in Fgf10 −/− than wt; length of midline structure across anterior/posterior axis is 32.4 ± 9.45% greater in Fgf10 −/− than wt; number of cells in a 100 µm wide radial traverse in 20 µm thick sections in rostral cortex is 34% ± 4.8% greater in Fgf10 −/− than wt. (D, E) Nissl staining of sagittal sections of P0 brain of wt (D) and Fgf10−/− mice (E). Rostral cortex is significantly thicker in Fgf10 −/− mice than in wt. (F – G’) Higher power views of Nissl stained sections through rostral and caudal cortex of wt and Fgf10 −/− mice. Laminar patterning in Fgf10 −/− cortex resembles wt, but the cellular layers are thicker in Fgf10 −/− rostral cortex compared to wt; no difference is evident between wt and Fgf10 −/− caudal cortex. (H) Quantification of cortical laminar thickness. Measurement were done at five different position as indicated (a to e) of the radial thickness from bottom of the subplate to the pial surface. (I) Percentage increase of cortical radial thickness in Fgf10−/− cortex compared to wt (Student’s test; p<0.001 for position a to d, and p<0.01 for e). Scale bars: 0.5 mm (A. B), 0.5 mm (D, E), 0.1 mm (F–G’).

