Figure 1.
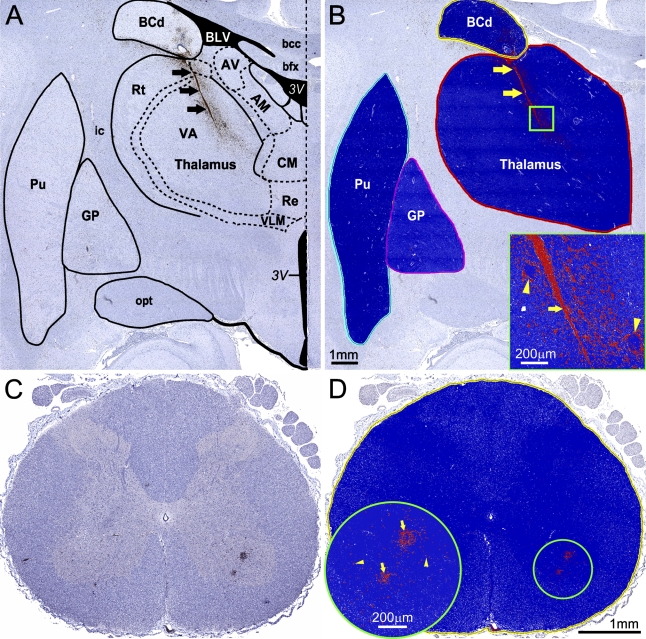
Computerized morphometric analysis (CMA) of immunostained cellular markers. (A,B) CMA of the activated microglia/macrophages [CD68-immunoreactivity (CD68-IR)] in the basal ganglia and thalamus of monkeys inoculated with yellow fever 17D (YF 17D) vaccine virus. (A) Neuroanatomical orientation and mapping of the central nervous system (CNS) regions of interest (ROIs) in the original scanned image using the “Primate Brain Maps: Structure of the Macaque Brain” CD (Martin and Bowden, 2000). (B) Outlining the ROI and applying the CD68-IR–customized positive pixel count algorithm. Results of ROI analysis are shown in the markup image by pseudo-color overlay (orange, moderately positive pixels; red, strong positive pixels; blue, negative pixels; white, neutral pixels that are neither positive nor negative). Inset in B shows the boxed area of thalamus (1 mm2) at higher magnification. Arrows (black in A, and yellow in B and inset) show intensive CD68-IR within and adjacent to the needle track resulting from intrathalamic inoculation of the virus. Yellow arrowheads in inset show CD68-IR on the periphery of perivascular inflammatory infiltrates within the zone of inoculation. AM, anteromedial nucleus of thalamus; AV, anteroventral nucleus of thalamus; bcc, body of corpus callosum; BCd, body of caudate nucleus; bfx, body of fornix; BLV, body of lateral ventricle; CM, central medial nucleus of thalamus; GP, globus pallidus; ic, internal capsule; opt, optic tract; Rt, reticular nucleus of thalamus; Pu, putamen; Re, reuniens nucleus of thalamus; VA, ventral anterior nucleus of thalamus; VLM, medial part of ventral lateral nucleus of thalamus; 3V, third ventricle. (C,D) CMA of the T cell infiltration (CD3-IR) in the spinal cord of monkeys inoculated with YF 17D vaccine virus. (C) Original scanned image of entire cross-section of the cervical region of the spinal cord. (D) Markup image showing the outlined ROI with applied CD3-IR–customized positive pixel count algorithm (red, strong positive pixels; blue, negative pixels; white, neutral pixels). Inset in D shows the circled area (1 mm diameter) of the ventral horn at higher magnification. Yellow arrows, perivascular CD3-IR; yellow arrowheads, parenchymal CD3-IR.

