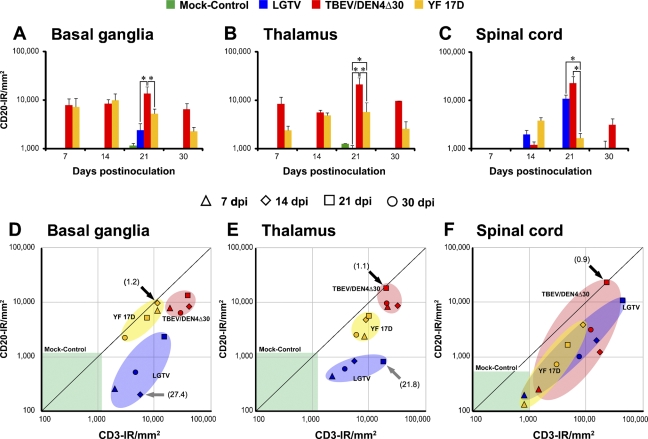
Figure 9.
Time course of B cell infiltration in the CNS of infected monkeys (A–C). Mean values of CD20-IR and SEs are shown on indicated dpi for the basal ganglia (A), thalamus (B), and spinal cord (C). Statistically significant differences in the mean values at 21 dpi (three to four monkeys per virus group) are indicated with asterisks (p<0.05). Analysis of the relative proportions of infiltrating T and B cells (D–F). Scatter plots showing relative proportions of T cells (CD3-IR/mm2) and B cells (CD20-IR/mm2) in the CNS of monkeys inoculated with LGTV (blue), TBEV/DEN4Δ30 (red), or YF 17D (yellow) on indicated dpi. Ratios representing equal or similar proportions of T and B cells are shown by black arrows. Ratios representing greater proportions of T cells compared with B cells are shown by gray arrows. The ranges of CD3-IR and CD20-IR values in the CNS regions of mock-control monkeys (one monkey per each time point) are shown by the green boxes.

