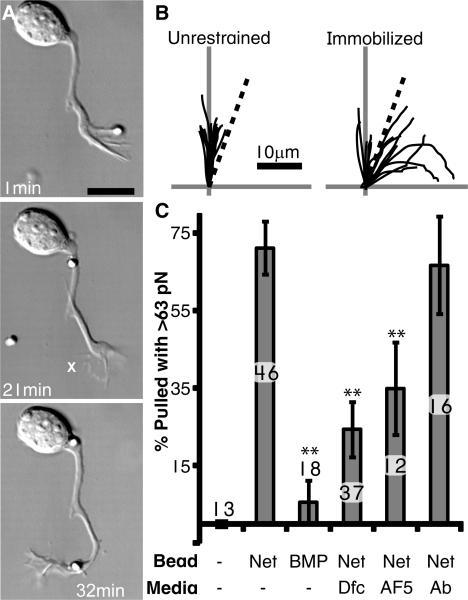
Fig. 1.
(A) A netrin-1 bead is presented and released upon contact on one side of the growth cone. After 22 min., another bead is presented, but this time it is attached to the substrate (marked ‘X’). Scale bar = 10μm. (B) Traces of axons confronted with unrestrained or immobilized netrin-1 beads. Vertical axis is the initial trajectory of the axon, while the dotted line marks a 20° angle. None of the 13 axons assayed turned at an angle >20° when unrestrained, while 10 of the 15 axons reoriented to immobilized beads. (C) Percent of beads pulled with >63 pN within 8 min (Ab = unspecific antibodies). The number of growth cones assayed is indicated above or within each bar. Error bars are S.E.M and ** = p<0.01 relative to netrin-1 (Tukey).

