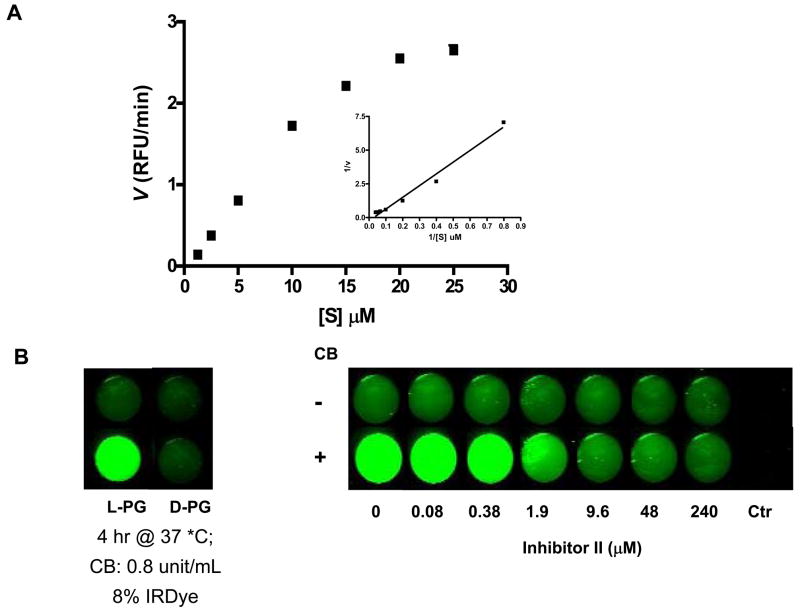
Fig. 4.
Enzymatic degradation of L-PG-NIR813. A: Kinetics of polymer degradation by CB. Various concentrations of L-PG-NIR813, from 0.625 μM to 25 μM, were incubated with 0.2 units of CB at 25°C for 1 h, and the initial velocity value (v) was obtained as described in Materials and Methods. The graph insets are Lineweaver-Burk plots of the transformed data. RFU, relative fluorescence units. B: Inhibition of L-PG-NIR813 degradation by CB inhibitor II. L-PG-NIR813 (8% loading; 10 μM eq. NIR813) was incubated with increasing concentrations of CB inhibitor II and 0.2 units of CB and imaged at 24 h as described in Materials and Methods. No L-PG-NIR813 was added in control wells. C: Degradation of PG-NIR813 by proteases of different classes. PG-NIR813 (40 μM eq. NIR813) was incubated with CB (0.04 unit), cathepsin L (0.04 unit), cathepsin D (0.08 unit), cathepsin E (0.08 unit), plasmin (0.03 unit), or MMP-2 (50 ng) at 37 °C over a period of 24 h. The buffer and pH value of the buffer used in the studies were selected according to manufacturer provided procedures. Fluorescence intensity only increased with the use of CB and cathepsin L. Data are presented as an average of duplicate experiments.

