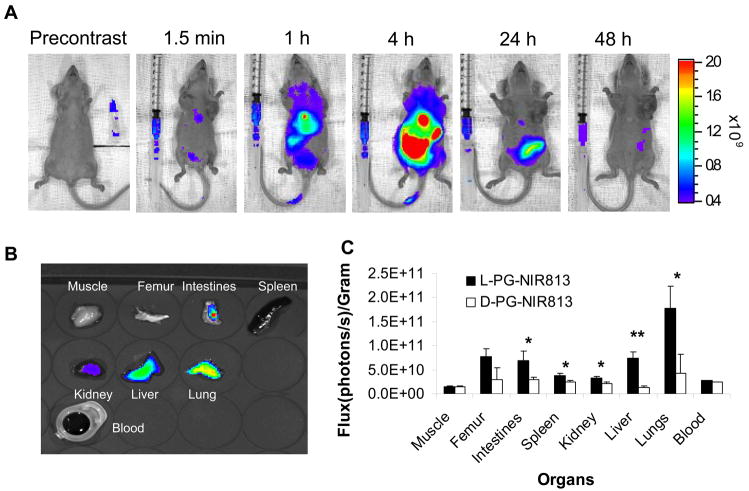
Fig. 6.
In vivo degradation of L-PG-NIR813. A: Representative whole-body NIRF images acquired at the indicated times after intravenous injection of L-PG-NIR813 at a dose of 10 nmol eq. NIR813 per mouse. The activity seen in intact animals primarily arose from the liver and the gut. B: Representative NIRF images of excised tissues at 4 h after conjugate injection. C: Distribution of fluorescence signals in various tissues at 4 h after injection of L-PG-NIR813 or D-PG-NIR813. The data represent mean ± SD (n = 3) (*, p < 0.05; **, p < 0.005).

