
Figure 3.
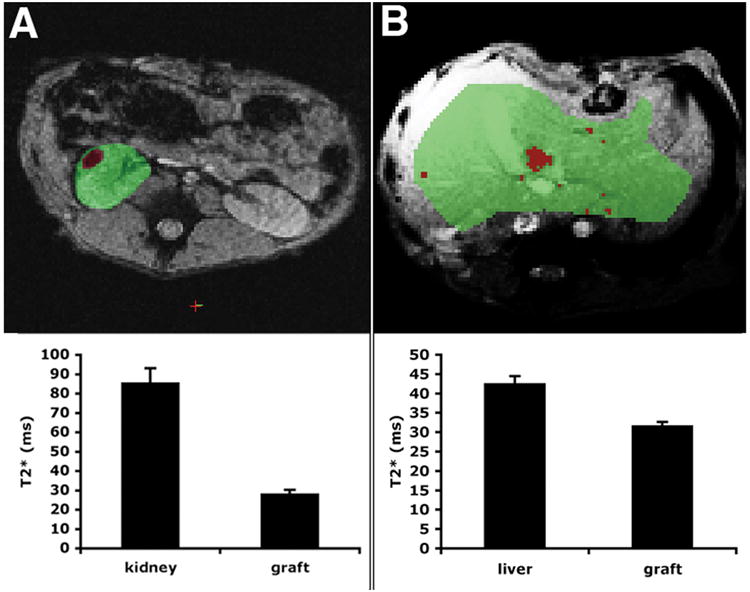
MR image segmentation for assessment of relative transplanted islet mass in the kidney (A) and liver (B) transplantation models. A region of interest (ROI) was drawn manually around the kidney or liver. An automated algorithm was used to segment the ROI into kidney/liver parenchyma (green) and islet graft (red) based on T2* values. Representative images (top) and the corresponding T2* values ± SD (bottom) are shown. The differential between the two labels was sufficiently large in order to reliably identify the graft (p < 0.05). The images are derived from animal B173.