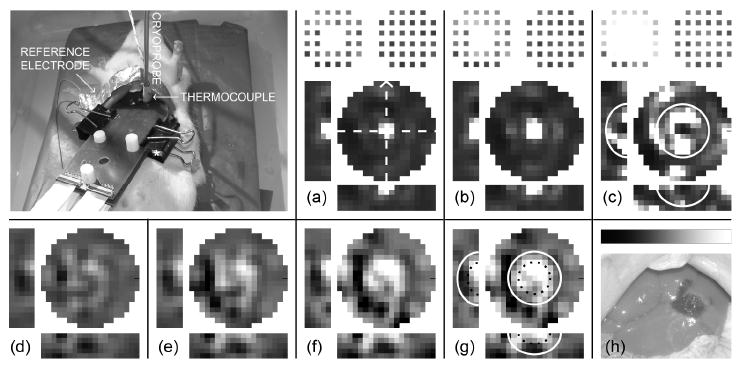
Figure 5.

In vivo ice front and viability imaging in a rat liver. Fractional change in (a)-(c) impedivity magnitude during freezing (|z*|/|z*|ref – black = 0, white = 5) and (d)-(g) its inverse (conductivity magnitude) during thawing (|σ*|/|σ*|ref – black = 0, white = 2.5) as compared with reference scan, for the in vivo experiment. Bar in (h) maps grayscale pixel values in linear fashion. Scan for (a) was taken 6 min after reference scan, where probe temperature was 12 °C; scans in (b) and (c) were taken during cooling, 4 and 8 minutes later (−2 °C and −25 °C respectively). Scans in (d)-(g) were taken during and after thawing, at times of 15, 21, 28 and 34 min after the reference scan ((d) was partially frozen; 2 °C probe temperature). From initial scan, liver conductivity was normally about 0.08 S/m. (h) Photo of treated liver after perfusion-fixation. * in photo designates 5-mm spacer. Solid white curves in (c) and (g) and dotted curves in (g) are superimposed from histology in figure 6(g).
