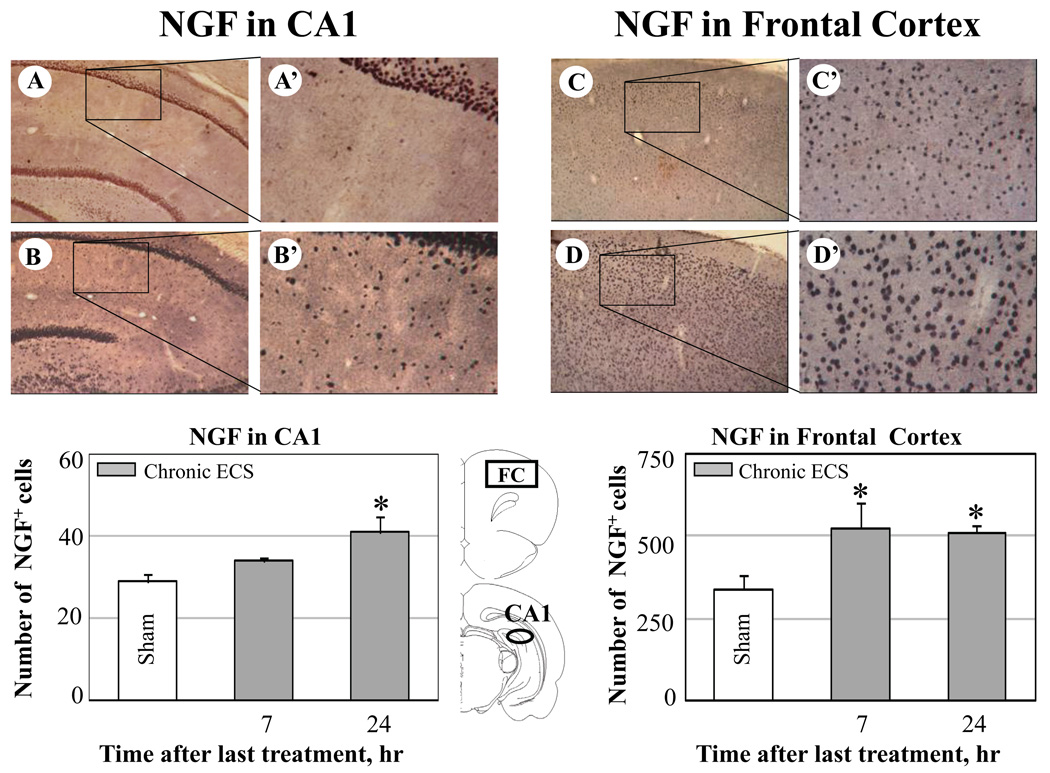
Fig. 7.
Effect of chronic ECS on NGF immunoreactivity in the CA1 subfield of hippocampus (A-A’, B-B’) and in the frontal cortex (FC) (C-C’, D-D’). Representative photographs illustrate NGF immunoreactivity in sham treated control animals (A-A’ and C-C’), and at 24 hr (B-B’ and D-D’) after chronic ECS treatment. Histograms show the mean values (for each groups of animals; n=6) of the number of NGF immunopositive cells after chronic (solid bars) ECS, as compared to control (sham ECS) group (open bars). Asterisks indicate significant difference (*P<0.05; ANOVA with Fisher’s test) from control group. The black areas in the schematic brain sections illustrate the regions from which the photographs and measurements were taken. Photographs were acquired at 10x (A – D) and 40x magnification (A’ – D’).

