Fig. 8.
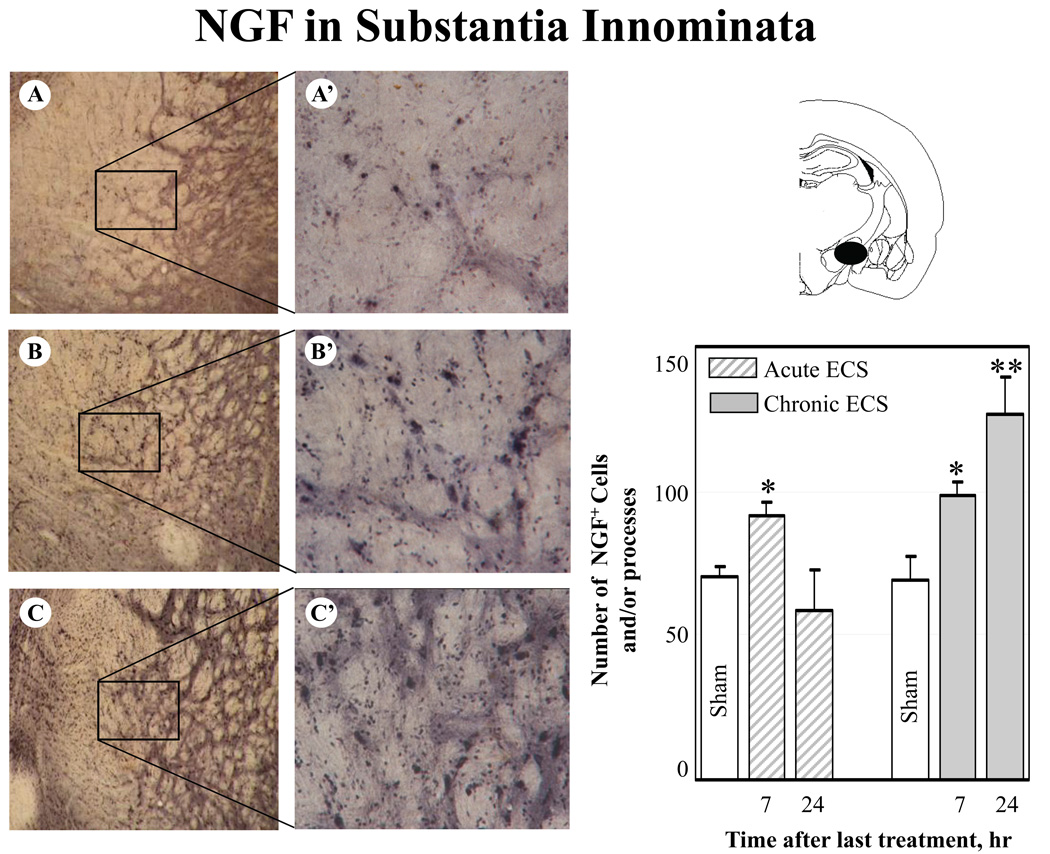
Effect of acute and chronic ECS on NGF immunoreactivity in the substantia innominata. Representative photographs illustrate NGF immunoreactivity in sham treated control animals (A), and at 7 hr (B) and 24 hr (C) after chronic ECS treatment. Histograms show the mean values (for each groups of animals; n=6) of the number of NGF immunopositive cells and/or processes after acute (striped bars) and chronic (solid bars) ECS, as compared to control (sham ECS) group (open bars). Asterisks indicate significant difference (*P<0.05 ; **P<0.01; ANOVA with Fisher’s test) from control group. A black area in the schematic brain section illustrates the region from which the photographs and measurements were taken. Photographs were acquired at 10x (A – C) and 40x magnification (A’ – C’).

