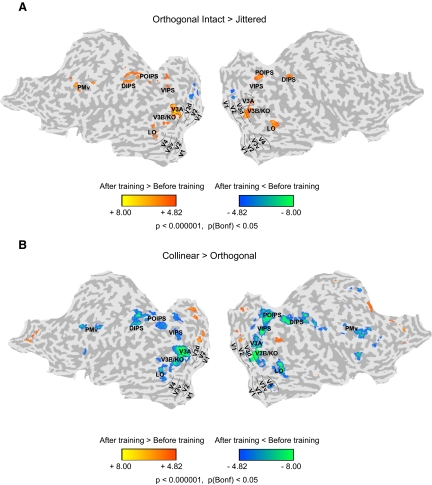
FIG. 2.
Univariate functional magnetic resonance imaging (fMRI) analysis: orthogonal intact vs. jittered contours. A: group general linear model (GLM) maps showing significant differences between sessions (before and after training) for the differential fMRI response to orthogonal intact vs. jittered contours. Data are presented on a flattened reconstruction of 2 cortical hemispheres. Positive t-values indicate that the difference in responses to intact vs. jittered orthogonal contours after training was larger than that before training (P < 0.05, Bonferroni corrected). Dotted lines indicate the borders between retinotopic visual areas. fMRI data from individual participants are shown in Supplemental Fig. S9. B: group GLM maps showing significant differences between sessions (before and after training) for the differential fMRI response to collinear vs. orthogonal contours. Data are presented on a flattened reconstruction of 2 cortical hemispheres. Negative t-values indicate that the difference in responses to collinear vs. orthogonal contours after training was lower than that before training (P < 0.05, Bonferroni corrected). Dotted lines indicate the borders between retinotopic visual areas.

