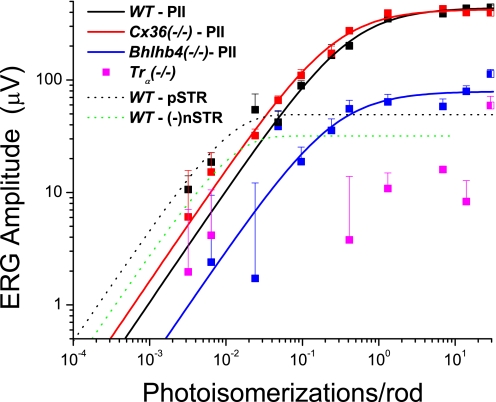
FIG. 5.
Analysis of the b-wave reveals 2 components: a sensitive pSTR shown as a dashed line and a less sensitive PII component, shown as solid lines. WT mice had a robust pSTR, which could be fit by an exponential function (see Table 2), whereas responses of Cx36(−/−) and Bhlhb4(−/−) mice in the range that produced the pSTR were not fit to the exponential function. For PII, WT and Cx36(−/−) had very similar maximum amplitudes and sensitivity (see Table 1).

