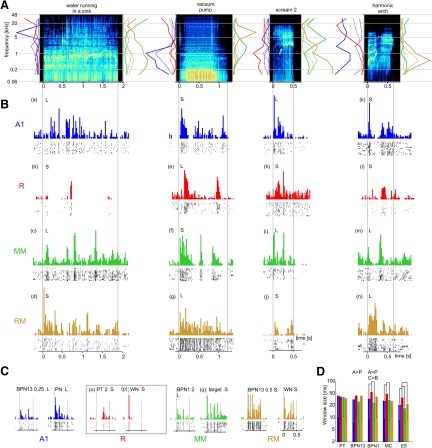
FIG. 6.
Temporal structure of neural responses. A: spectrograms of example environmental sounds and monkey calls. Line plots along each spectrogram's frequency axes show tuning profiles [rate-(center)frequency curves] of example units, whose responses to these sounds are shown below in B. Solid line, “on” tuning profile; dotted line, “sustained” tuning profile; line color indicates the cortical field in which the unit was found and matches the color of the unit's PSTHs in B. Tuning profiles averaged across PTs and BPNs. Plots normalized to maximum peak firing rate (PFR) produced by the unit in respective (“on” or “sustained”) response. B: PSTHs and raster plots obtained from example units in response to stimuli shown above in A. Each row contains examples from one cortical field: A1, R, MM, or RM. Individual monkeys are identified with letters L and S. Vertical lines show stimulus start and end. PSTHs binned with 20 ms. The PSTH ordinate shows spike count normalized to maximum spike count found for all stimuli in the unit. Individual responses are referenced using (a)–(q) labels when described in results. C: PSTHs and raster plots obtained from example units in response to tones, band-pass, and wide-band noise bursts. PT, pure tone; BPN13, 1/3-octave band-pass noise; BPN1, 1-octave band-pass noise; PN, pink noise; WN, white noise; target, behavioral target (4-tone “melody”; only 12 first sweeps out of 96 obtained are shown in the raster plot for the target). Numbers show stimulus (center) frequency of PT and BPN in kilohertz. Responses in gray rectangle come from the same unit. D: effect of stimulus class and cortical field on best discriminator window. Significant differences marked with “>” signs (main effects) or with lines joining bars (post hoc comparisons). A: anterior fields (R + RM); P: more posterior fields (A1 + MM); C: core (R + A1); B: medial belt (RM + MM).

