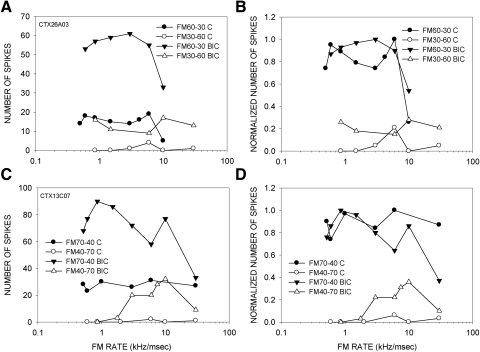
FIG. 5.
A: in this neuron there was no change in DSI during BIC application (15 nA) despite a 4-fold increase in response magnitude. B: normalized plot of the data shown in A shows relative changes in response during BIC application. C: a 2nd neuron in which BIC (25 nA ejection current) produced a decrease in DSI (from 0.88 to 0.5) but did not eliminate direction selectivity. D: normalized plot of data in C.

