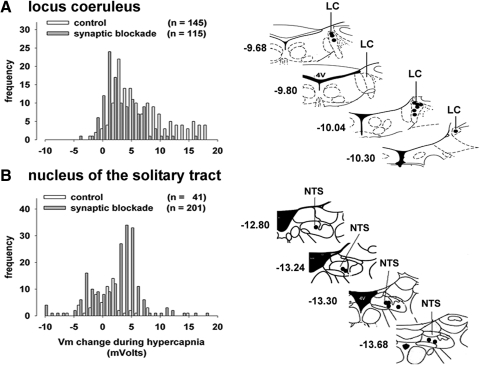
FIG. 5.
Changes in membrane potential of neurons in dorsal chemosensory nuclei: the LC and nucleus of the solitary tract (NTS). A: histogram of the membrane potential changes (in mV) of LC neurons after hypercapnic treatment. The anatomical sites from which the data in A were taken are shown to the right. B: histogram of the membrane potential changes of NTS neurons during hypercapnic treatment, and the anatomical sites studied are shown on the right. All dimensions on the anatomical figures are measured from the bregma.

