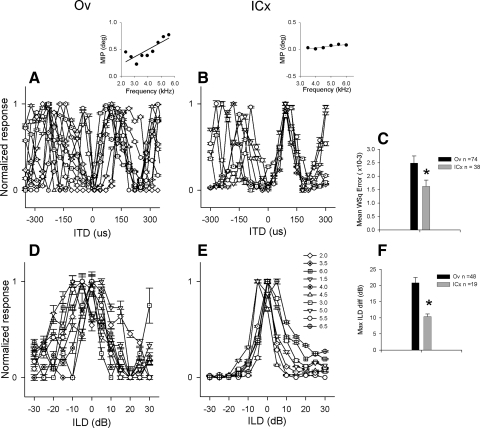
FIG. 5.
ITD and ILD tuning across frequency in ICx and Ov. Rate-ITD curves obtained at different frequencies in an Ov (A) and an ICx (B) neuron. Insets: plots of mean interaural phase (MIP) as a function of stimulating frequency with corresponding linear regressions (—). Note the less linear relationship in Ov than in ICx. C: weighted mean square residuals in Ov (▪) and in ICx ( ), t-test, P = 0.01. Rate-ILD curves for tones in Ov (D) and in ICx (E). Each frequency was represented by a different symbol (shown in E in kHz). F: maximal difference (Max ILD diff) between best ILDs across frequency in Ov (▪) and in ICx (
 s), t-test, P = 0.0002. Error bars in E and F represent SE.

