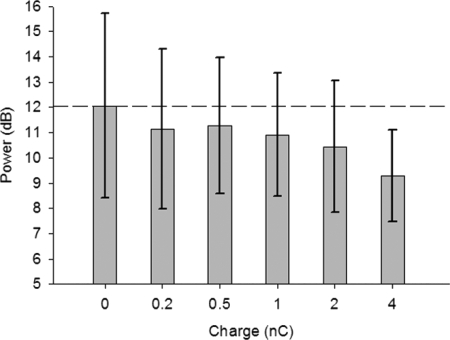
FIG. 6.
DBS dose response. Data are the maximum power in the ECoG between 20 and 45 Hz (mean power removed) as a function of charge delivered (mean, SD) from all 5 parkinsonian animals, regardless of Frequency and State. For each of the 5 charges shown, the actual charge delivered (current amplitude × pulse width) was rounded to the nearest nanocoulomb and grouped according to Fig. 1. Only 4-nC charge produced significant decreases in cortical oscillation power, suggesting that this is the minimum amount of charge needed to observe this effect in this study.

