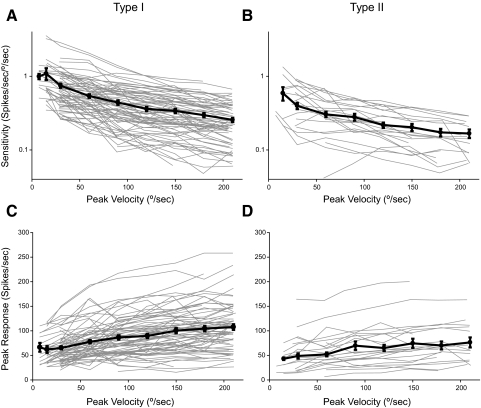
FIG. 3.
Sensitivity (A, B) and peak of the response (C, D) as a function of the peak velocity of rotation for type I (A, C) and type II (B, D) neurons. Faint lines are data for the 74 type I and 24 type II neurons for which data are available for at least 5 velocities of rotation. Solid lines and circles are the average for all units studied. Error bars are SEs. Sensitivity plotted in log scale (A and B).

