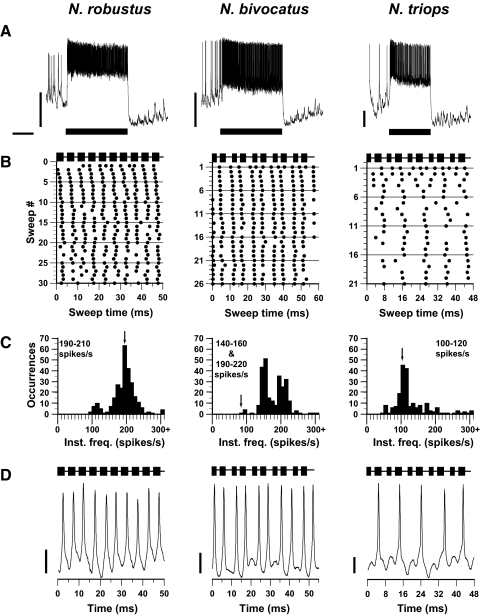
FIG. 3.
AN-1 responses to conspecific calls presented at 60 dB SPL for the 3 Neoconocephalus species tested. A: neural responses to conspecific calls taken from intracellular or quasi-intracellular dendritic recordings. Note the different voltage scales each trace across species. Bar represents the call stimulus; scale bars: 500 ms; 10 mV. B: raster plots of responses to conspecific calls shown in A. Each call was divided into sweeps containing 10 pulses, with each sweep beginning at the onset of a pulse. The stimulus marker above each raster plot indicates the timing of the single pulse rates for N. robustus and the double pulse rates for N. bivocatus and N. triops. Sweep lengths were as follows: 50 ms for N. robustus, 57.5 ms for N. bivocatus, and 47.08 ms for N. triops. Number of sweeps varied because of call parameters and duration of the call stimulus tested. C: instantaneous frequency histograms for neural responses shown in B. N. robustus single pulse call rate = 200 pulses/s; N. triops double pulse rate = 106 pulses/s; N. bivocatus double pulse = 87 pulses/s (arrows). D: intracellular or quasi-intracellular neural responses for 1 sweep for each of the 3 Neoconocephalus species. Note the different voltage scales each trace across species. Scale bars: 5 mV.

