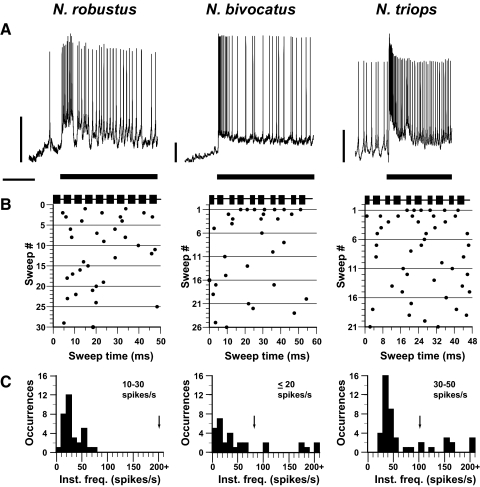
FIG. 5.
AN-2 responses to conspecific calls presented at 60 dB SPL for the 3 Neoconocephalus species tested. A: neural responses to conspecific calls taken from intracellular or quasi-intracellular dendritic recordings. Note the different voltage scales each trace across species. Response for N. bivocatus is truncated. Bar represents the call stimulus; scale = 500 ms; 10 mV. B: raster plots of responses to conspecific calls shown in A. Sweep lengths and number were the same as for AN-1 (Fig. 3B). C: instantaneous frequency histograms for neural responses shown in B. Arrows indicate each conspecific call rate (same as listed in Fig. 3C).

