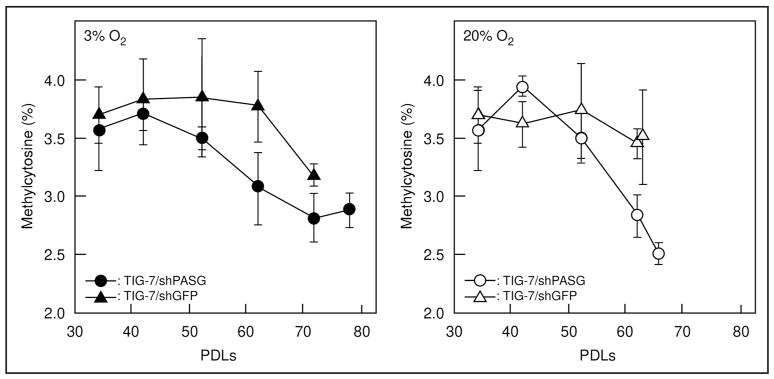
Figure 6.
Change in methylcytosine content of total genomic DNA during the passage. The rate of methylcytosine content was determined by LC-MS analysis as described in Materials and Methods. Left and right panels represent results when the cells were cultured under 3% and 20% oxygen, respectively. Values are means ± S. D. of four independent results.

