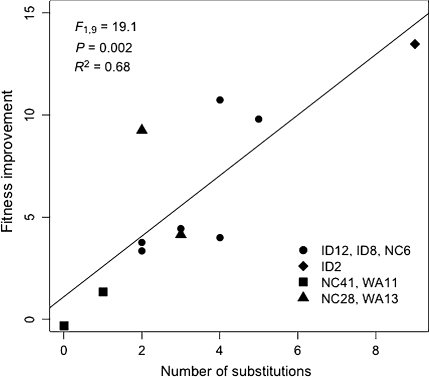
Fig. 3.
Fitness improvement and the number of mutations fixed during adaptation. A significant positive correlation was found between the number of substitutions and the magnitude of fitness improvement for an adaptive walk (R2 = 0.68, F1,9 = 19.1, P = 0.002). The regression line is shown. Phylogenetic groups (see Fig. 1) are designated with different symbols

