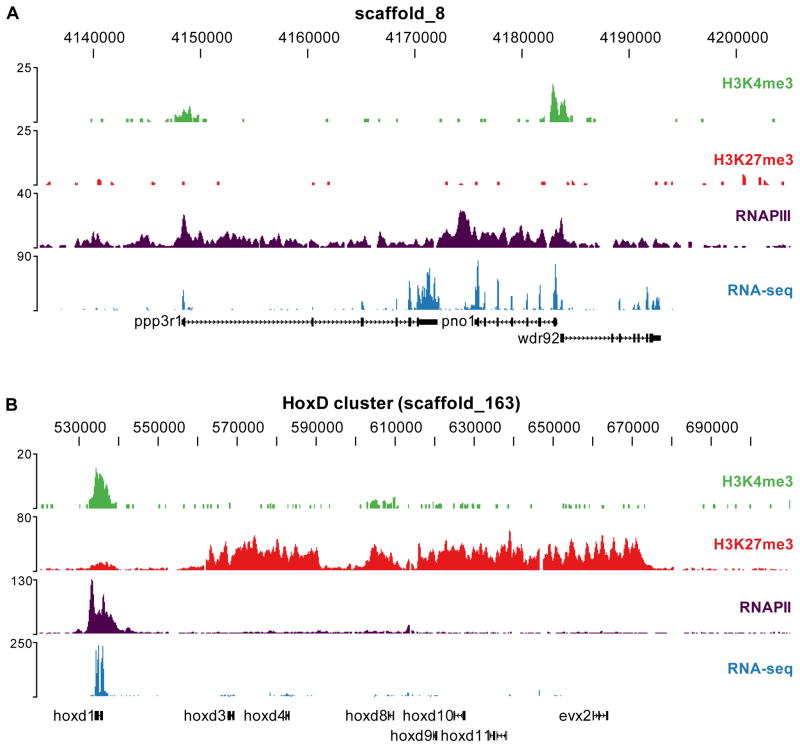
Figure 1. Histone methylation profiles and the transcriptome of the Xenopus tropicalis gastrula embryo.
Profiles of H3K4me3 (green), H3K27me3 (red), RNAPII (purple) and RNA-seq (blue) are visualized using the UCSC Genome Browser for two genomic regions. (A) The upper panel shows a region on scaffold_8 with three expressed genes (ppp3r1, pno1 and wdr92). (B) The lower panel shows the HoxD cluster on scaffold_163.

