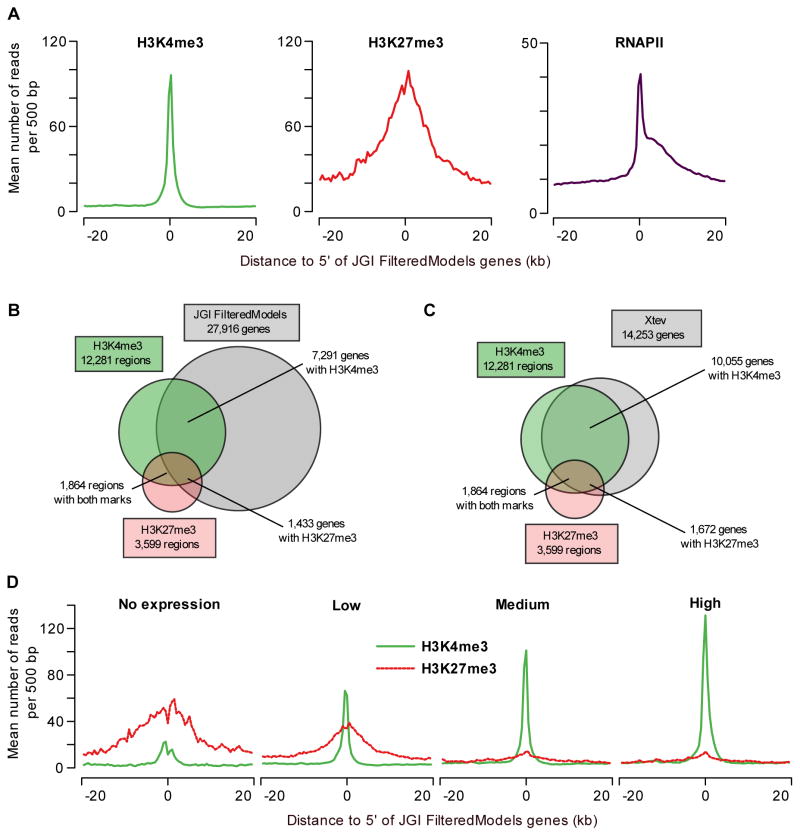
Figure 2. Primary data analysis and comparison to gene models.
(A) Profiles of H3K4me3, H3K27me3 and RNAPII at annotated genes. The average H3K4me3 read coverage for genes with a H3K4me3-enriched region within 1kb of the JGI FM genes annotated 5′ end is shown in the left panel (mean number of reads per 500bp, green). The middle panel shows the equivalent for H3K27me3 (red) and the right panel for RNAPII (purple). (B) Overlap of H3K4me3- and H3K27me3-enriched regions with JGI FM genes (within 1kb of the annotated 5′ end). (C) Overlap of H3K4me3- and H3K27me3-enriched regions with Xenopus tropicalis experimentally validated genes (within 1kb of the annotated 5′ end). (D) H3K4me3 and H3K27me3 correlate with gene expression levels. JGI FM genes were divided in equal-sized groups based on normalized RNA-seq expression level (no, low, medium and high expression). For these groups H3K4me3 (green) and H3K27me3 (red-dotted) occupancy profiles (mean number of reads per 500bp) are shown.

