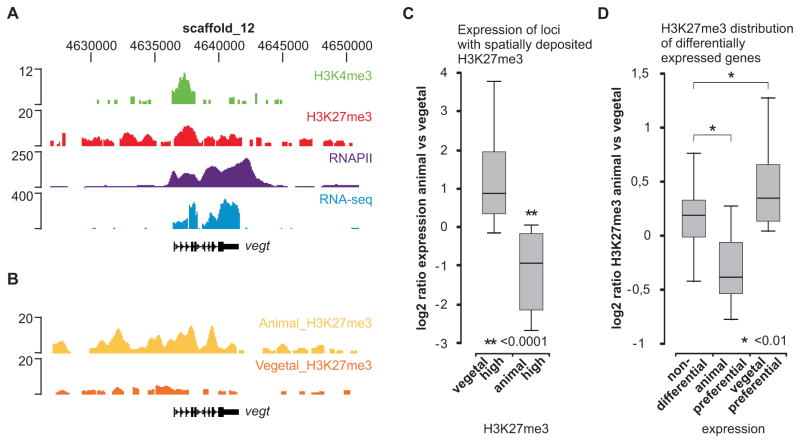
Figure 5. Spatial deposition of H3K27me3 is predictive of localized expression.
(A) The vegt locus is visualized using the UCSC genome browser; H3K4me3 (green), H3K27me3 (red), RNAPII (purple) and RNA-seq (blue). (B) H3K27me3 ChIP-seq of animal and vegetal halves (stage 10–12). The vegt gene is most enriched for H3K27me3 in the animal hemisphere. (C) qRT-PCR expression ratio (animal/vegetal) of genes with animal-high (n=4) or vegetal-high (n=25) H3K27me3 (normalized H3K27me3 ChIP-seq ratio, 2Log > 1). (D) Normalized H3K27me3 ChIP-seq ratio (2Log animal/vegetal) of genes with expression differences: non-differential (n=195), animal preferential (n=9) and vegetal preferential genes (n=35). Numbers refer to genes that are both enriched for H3K27me3 in whole embryos and included in the microarray data (Zhao et al., 2008).

