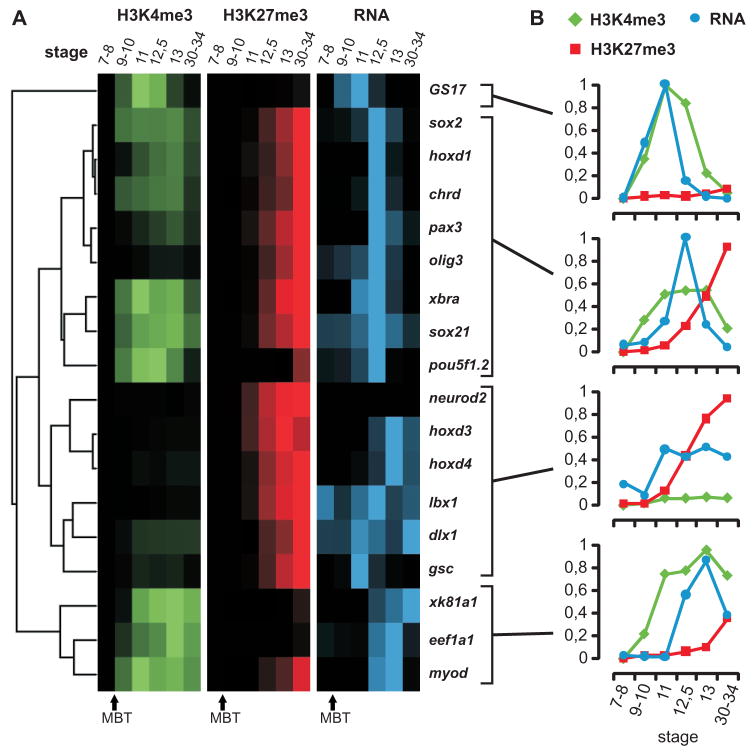
Figure 6. Dynamic regulation of epigenetic marks and gene expression during development.
(A) Hierarchical clustering results of relative ChIP recoveries for H3K4me3 (green) and H3K27me3 (red) and RT-PCR for stages 7–34 of developmentally regulated genes (blue). Intensities of the signal show high or low ChIP enrichment and expression. (B) The panels show the average relative ChIP recoveries for H3K4me3 (green), H3K27me3 (red) and expression values (qRT-PCR in blue) of the corresponding stages 7–34 for the four clusters. ChIP signals represent the average of a biological duplicate experiment.

