
Figure 4.
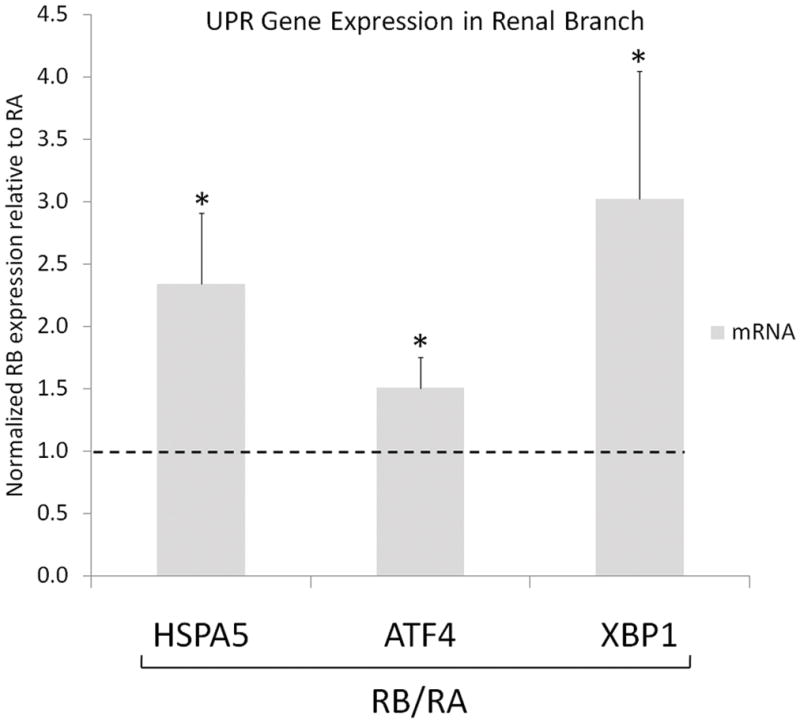
UPR gene expression at renal branch and renal artery. HSPA5, ATF4 and XBP1 transcript in renal branch, RB, normalized to renal artery, RA, for each paired sample based on their animal origin. Gene expression (n= 6 paired samples) was normalized to GAPDH. Values >1.0 indicate higher expression in RB. Data represent mean±SEM. *p≤0.05 one-sample, one sided, paired Wilcoxon test.