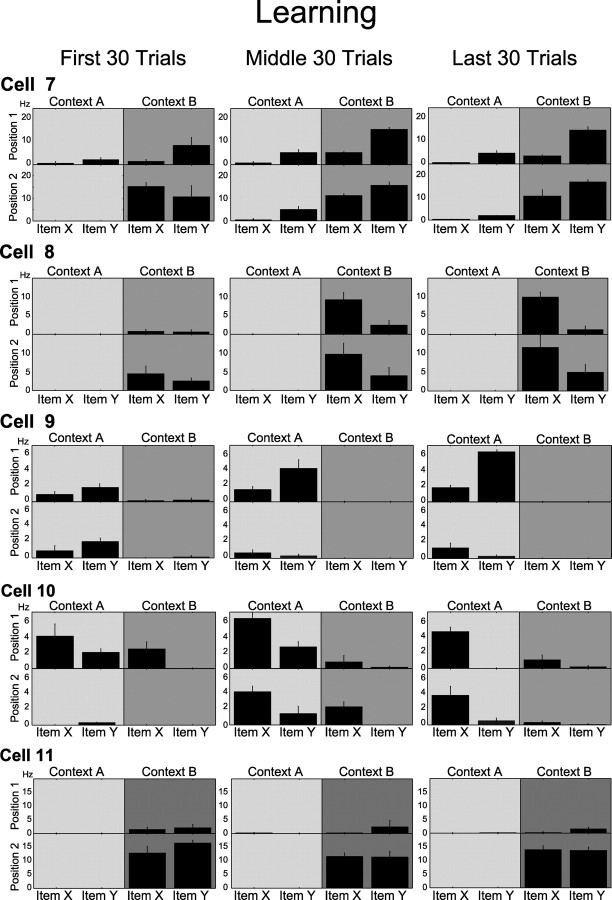
Figure 4.
Example cells recorded during a learning session. Panels in each row show the average ± SE firing rate of a cell during stimulus sampling for early, criterion, and late trial blocks. Each panel shows the average firing rate during sampling of items X and Y at each of two positions within a context (represented with different shades of gray). Cells 7–10 were classified as item–position cells in the last 30 trial block but not in the first 30 trials. Cell 11 was classified as a position cell in all trial blocks.

