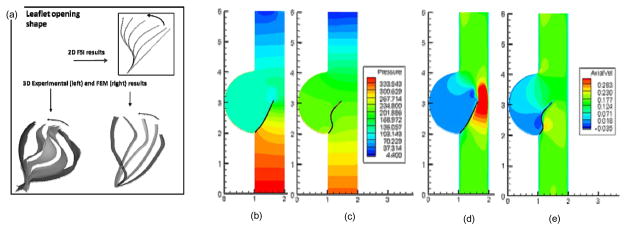
Figure 3.
(a) Stress computed during the opening phase of the cardiac cycle using experimentally determined leaflet material properties and physiologic pressure boundary conditions on the fluid. Leaflet motion computed using 2D FSI simulation (Vigmostad et al., 2008), 3D flow loop experiments (Iyengar et al., 2001), and 3D FEM computations (Kim et al., 2008). (b–e) Here, the same boundary conditions are employed for both simulations, but with different for material properties. Results showing a comparison of the pressure build-up (in Pa) with a high stiffness valve (b) and physiologic valve properties (c). In (d–e), axial velocity (in m/s) is shown for the two cases.

