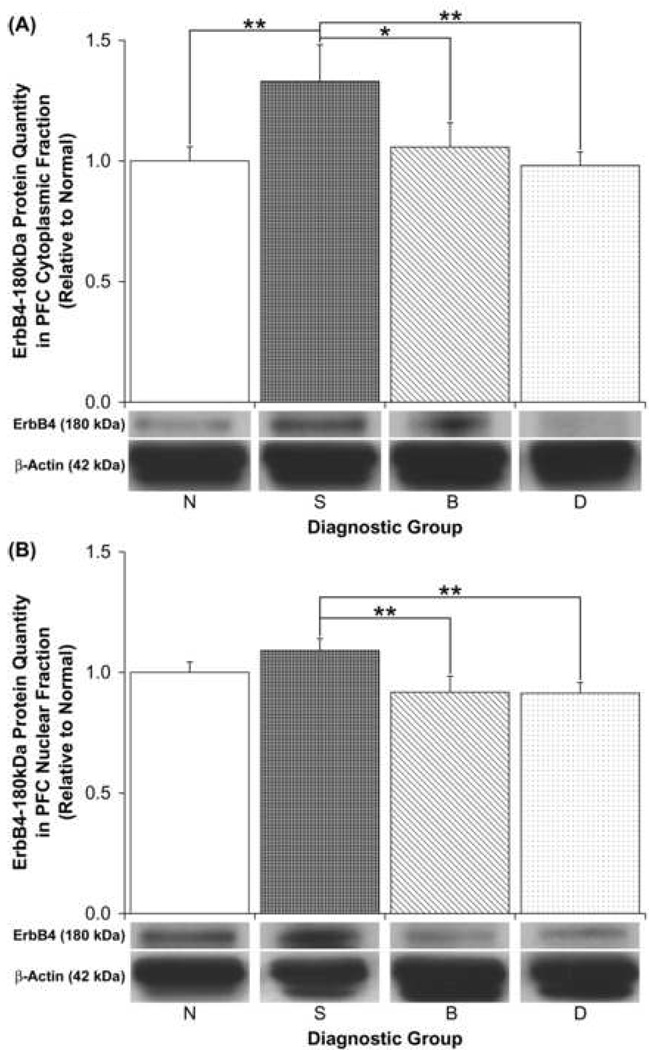
Figure 4.
Relative PFC (a) cytoplasmic and (b) nuclear ErbB4-180kDa protein quantities among diagnostic groups. Representative sections of immunoblots are shown below the graphs. Data are expressed relative to normal (N) subjects, and error bars represent standard errors. S, Schizophrenia; B, Bipolar disorder; D, Depressed (*p = 0.058; **p ≤ 0.03).

