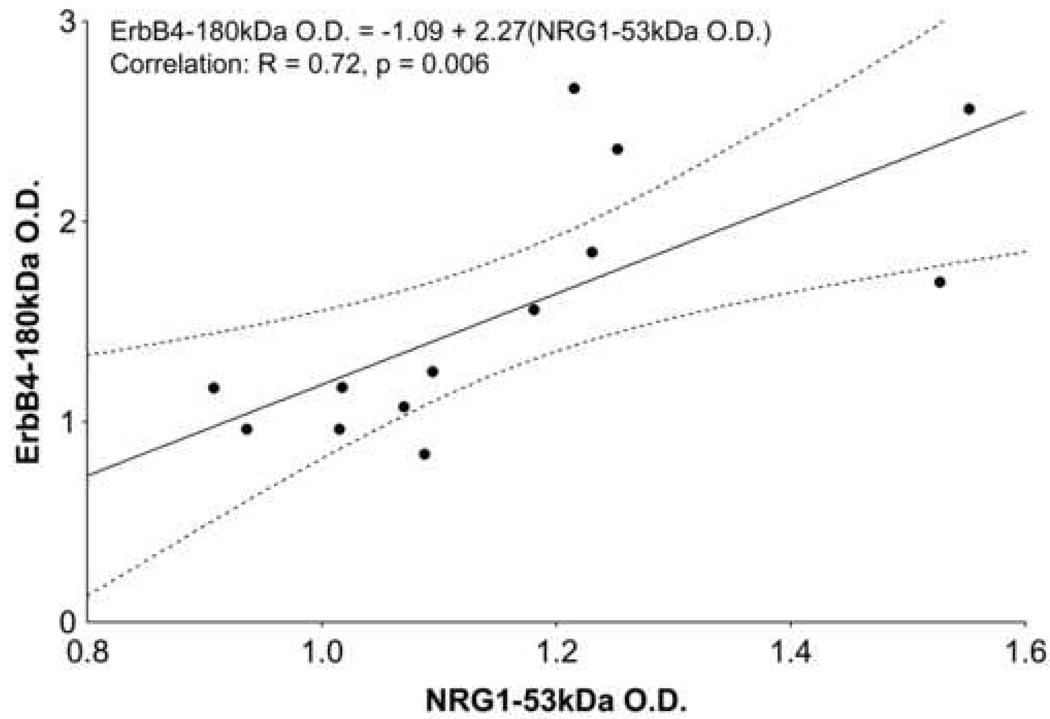
Figure 6.
Correlation between ErbB4-180kDa and NRG1-53kDa protein quantities in PFC cytoplasmic fractions of schizophrenic patients. A correlation was observed specifically between these fragments exclusively in schizophrenic subjects. Equation of best fit line (solid line), along with correlation coefficient (R) and p-value, is inset. Dots represent data points; dotted line encloses data within 95% confidence.

