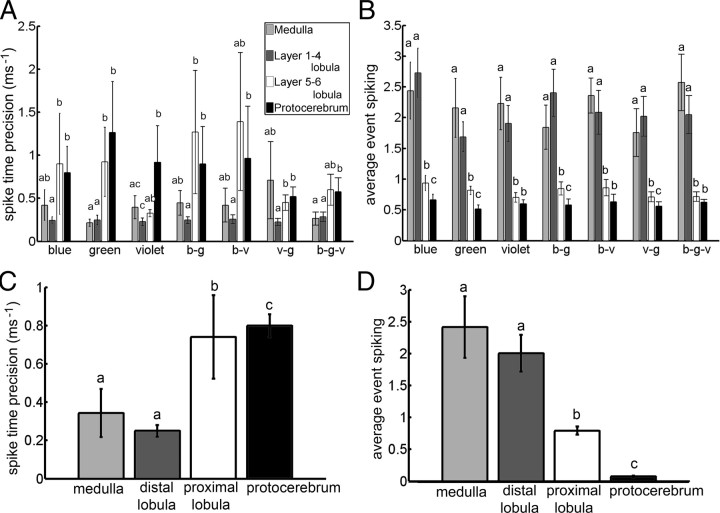
Figure 6.
Spike time precision and average event reliability across neural classes. A, Spike time precision values for the medulla, distal lobula (layer 1–4 lobula), proximal lobula (layer 5–6 lobula), and protocerebral neurons for different colors and color combinations. B, Average event reliability for the same neurons for different colors and color combinations. C, Average spike time precision values across all colors and color combinations for the same neural categories. D, Average event spiking values across all colors and color combinations for the same neural categories as above. Error bars indicate SE; each letter in the graph represents groups (i.e., a, b, or c) that are statistically significant from one another. For example, group “a” is significantly different from group “b” and group “c” just as groups “b” and “c” are statistically significantly different from each other (p < 0.05; Mann–Whitney U test). Data describing medulla and lobula neuron responses from Paulk et al. (2008, 2009).

