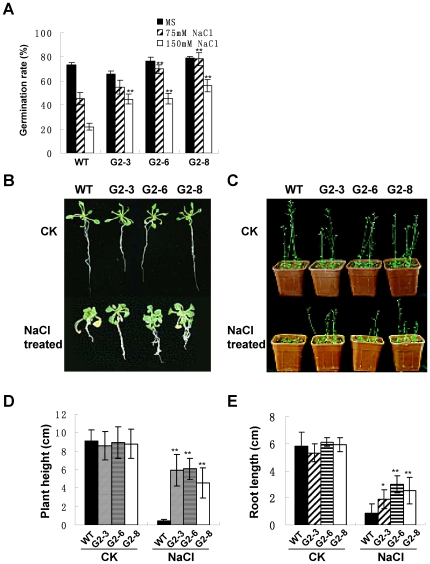
Figure 8. Performance of the GmPHD2-transgenic plants under salt stress.
(A) Seed germination under salt stress. The seed germination rate of transgenic lines (G2–3, G2–6, G2–8) was calculated 5 d after sowing. Each data point is the means of three replicates and bars indicate SD. (B) Plant growth in NaCl medium. Five-day-old seedlings were treated on plate without (CK, top) or with 150 mM NaCl (NaCl treated, bottom) for two weeks. (C) Recovery of salt-stressed plants in pots. Seedlings treated with 150 mM NaCl (NaCl treated, bottom) or without NaCl (CK, top) were transferred to pots and grown for two weeks under normal conditions. (D) Comparison of plant height after salt stress treatment. Plant heights in (C) were measured. Values are means±SD (n = 54). (E) Comparison of root length after salt stress treatment. Root length of plants in (C) was measured. Values are means±SD (n = 54). For (A), (D) and (E), “*” and “**” indicate significant difference (P<0.05 and P<0.01 respectively) compared to the corresponding WT plants.

