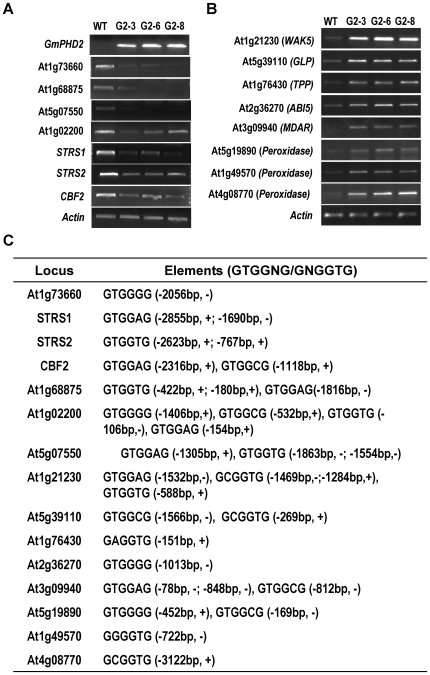
Figure 9. Expression of GmPHD2-regulated genes in the transgenic plants.
(A) Downregulated gene expression in GmPHD2-transgenic plants (G2–3, G2–6, G2–8) revealed by RT-PCR. Two-week-old seedlings were used for RNA isolation. Actin was amplified as a control. (B) Upregulated gene expression in GmPHD2-transgenic plants. (C) Putative cis-DNA elements for GmPHD2 binding in promoter regions of the downregulated and upregulated genes. Numbers indicate the positions upstream the start codon for each gene. “−” indicates that the element was on the antisense strand. “+” indicates that the element was on the sense strand.

