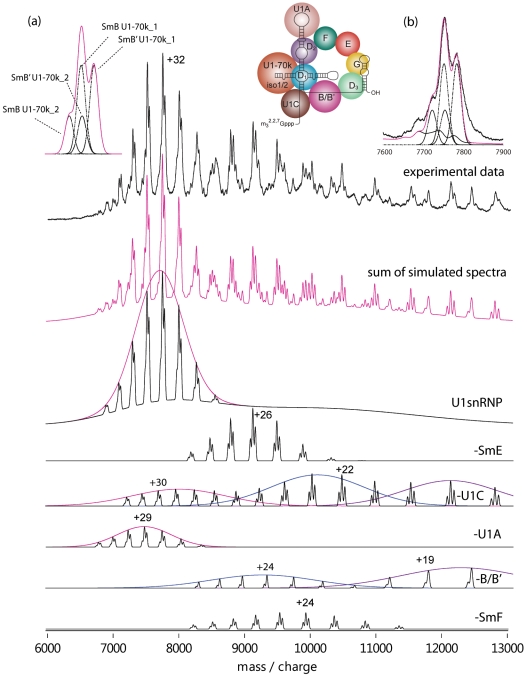
Figure 2. Simulation of the components of the spectrum recorded under higher activation conditions:
(a) The convolution of the four isoforms U1-70k_1, U1-70k_2, Sm-B and Sm-B' gives rise to a triplet of peaks. The width of these peaks was selected based on the experimental peak width for the 32+ charge state: a similar profile is expected for all charge states. (b) Fitting of these Gaussian distributions to experimental data recorded for the subcomplexes and intact particle. Main panel: the charge state distributions of the various components fitted to Gaussian distributions of charge states leading to distinction between solution phase products (pink envelope, -U1C) and losses of partially and more unfolded subunits (blue and purple envelopes, -U1C and -B/B') respectively. Summation of the charge state distributions modelled for the intact complex and multiple sub-complexes generates a simulated spectrum (pink) in close agreement with the observed data (top spectrum, black).

