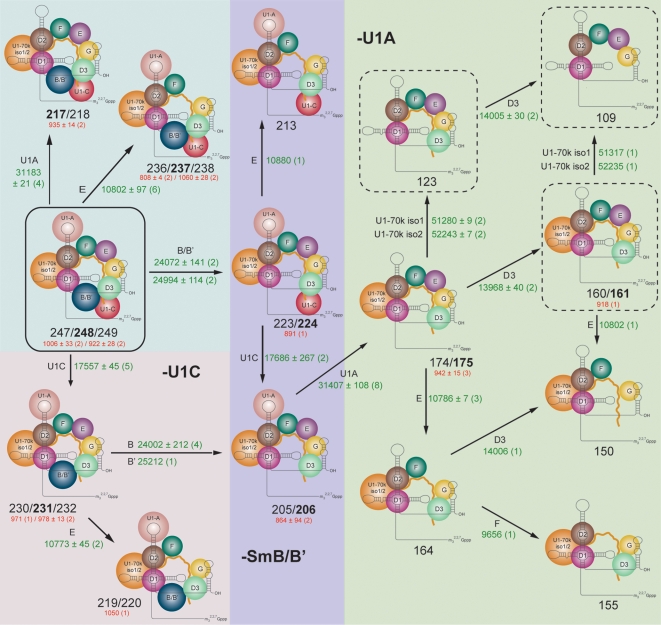
Figure 3. Summary of sub-complexes derived from U1 snRNP showing that the major dissociation pathways involve losses of U1-C, Sm-B/B', Sm-E and U1-A.
Average experimentally-determined mass differences (green text with the number of spectra in parenthesis) acquired under a range of solution and MS conditions. Average experimentally-determined mass differences between the split peaks are given in red (number of spectra in parenthesis). Masses of each sub-complex are quoted in kDa (black text) with major species indicated in bold. Dotted borders indicate sub-complexes observed only as solution-phase species from the intact complex (solid border).

