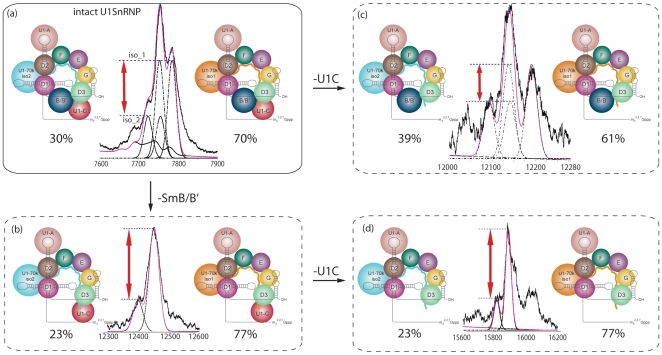
Figure 5. Monitoring changes in the ratio of the U1-70k isoforms in charge states of the intact spectrum and dissociation products.
All peaks are scaled according to the ratio of the U1-70k isoforms(red arrows) to enable direct comparison irrespective of the presence of Sm-B/B'. The ratio of isoform 2: isoform 1 in the intact complex is (70∶30) (a). For loss of U1-C the isoform 2 : isoform 1 ratio decreases to 39∶61 (b) while loss of Sm-B/B' leads to an increase in the ratio 23∶77 (c). Subsequent loss of U1-C from the complex in which Sm-B/B' is absent reveals the same isoform ratio (23∶77) as observed for the loss of Sm-B/B'.

