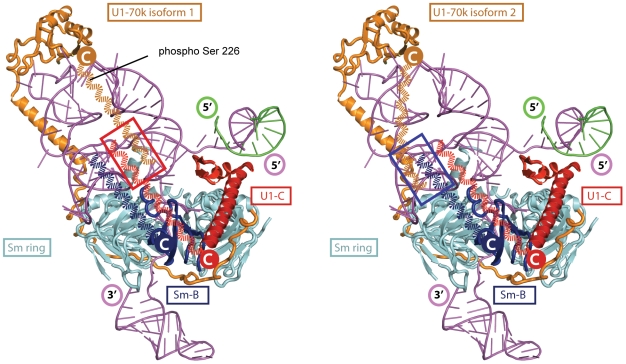
Figure 6. A model of interactions between the C-terminal tails of U1-70k isoforms 1 (left) and 2 (right) with U1-C and Sm-B/B', respectively.
Possible path of the C-terminal tails of two U1-70k isoforms drawn approximately to scale (dashed curved orange lines) and modeled onto the crystal structure of human U1 snRNP [17] and interactions between C-terminal tails of U1-C and SmB/B' are highlighted (red and blue boxes respectively). Indicated are: U1 snRNA (magenta); Sm-B/B' (blue); Sm-D1, D2, D3, E, F and G (cyan); U1-70k (orange); U1-C (red); speculative path of the C-terminal tails of U1-70k isoforms 1 and 2 (dashed orange lines).

