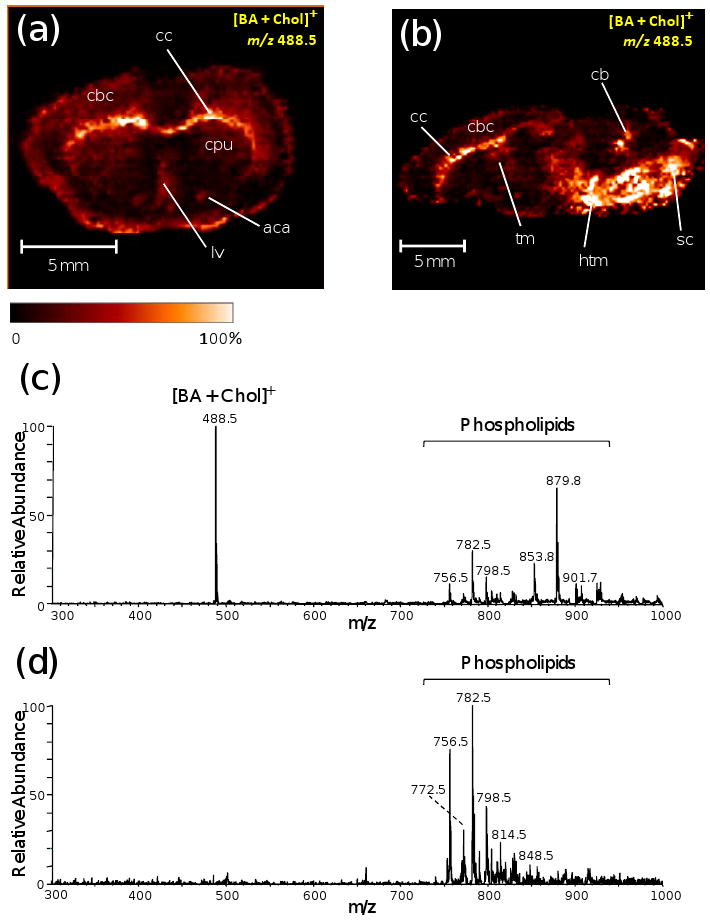
Figure 4.

Cholesterol images at m/z 488.5 in (a) 14×8 mm coronal section of rat brain and (b) 22× 8 mm sagittal section of rat brain observed by reactive DESI in the positive ion mode (65 ppm BA in a solvent of ACN/H2O/DMF (8:3:1)). cc=corpus callosum; cpu=striatum; cbc=cerebral cortex; lv=lateral ventricle; aca=anterior part of anterior commissure; cb=cerebellum; sc=spinal cord; tm=thalamus; htm=hypothalamus (c) Reactive DESI mass spectrum (background subtracted) of rat brain tissue using a solvent of ACN/H2O/DMF (8:3:1) doped with 65 ppm BA, showing derivatized cholesterol (with S/N ≫ 100) and various phospholipids. (d) Normal DESI mass spectrum (background subtracted) of rat brain tissue using ACN/H2O/DMF (8:3:1) as the spray solvent without adding the BA reagent.
