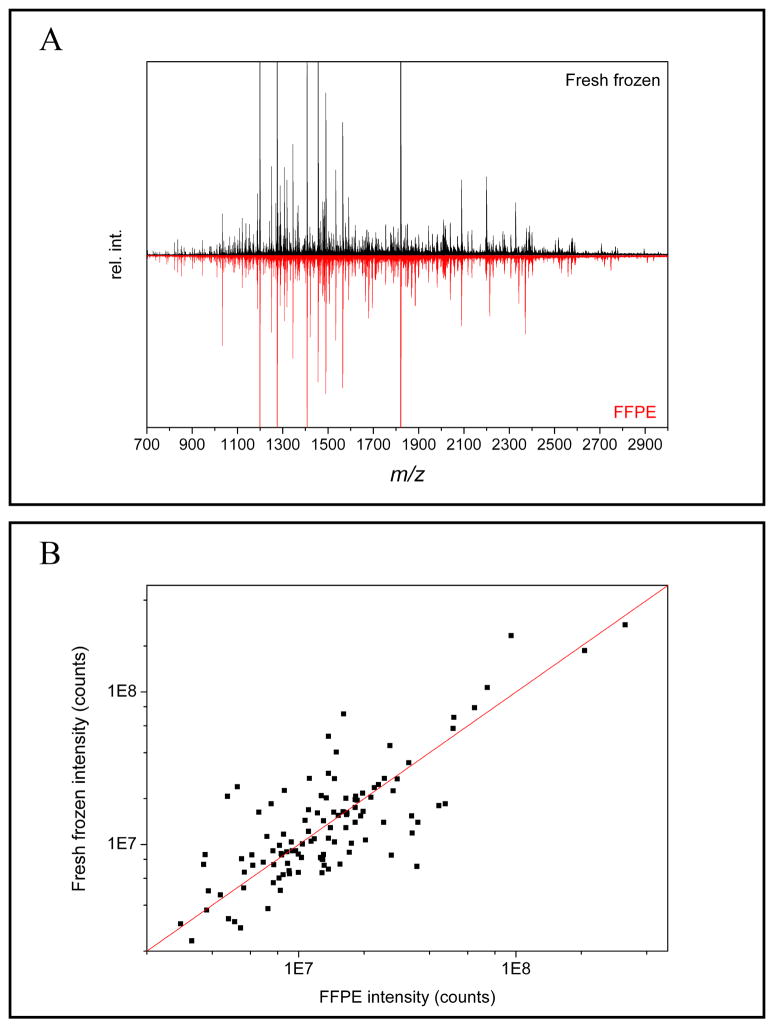
Figure 3.
A) Comparison of MALDI FTICR spectra obtained after electrophoretic clean-up of fresh frozen and FFPE mouse liver tissue after antigen retrieval and digestion. Spectra from cation capture experiments are presented showing similar peak patterns. B) Distribution of the peak intensity ratios of common peaks are centered around the expected peak ratio of 1.

