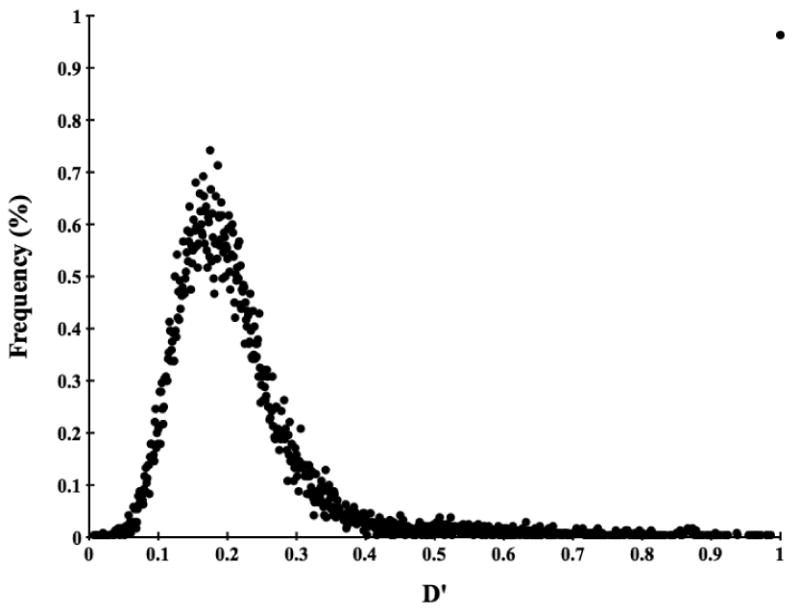
Figure 1.

Distribution of D′ for pairs of unlinked loci on different chromosomes. Approximately 1 % (231) of the pairs of loci has a D′ value of 1. However, when LD for these pairs is estimated by χ2′, they have a distribution similar to that of χ2′ for all pair-wise loci, indicating that these high D′ values are artifacts.
