Figure 4.

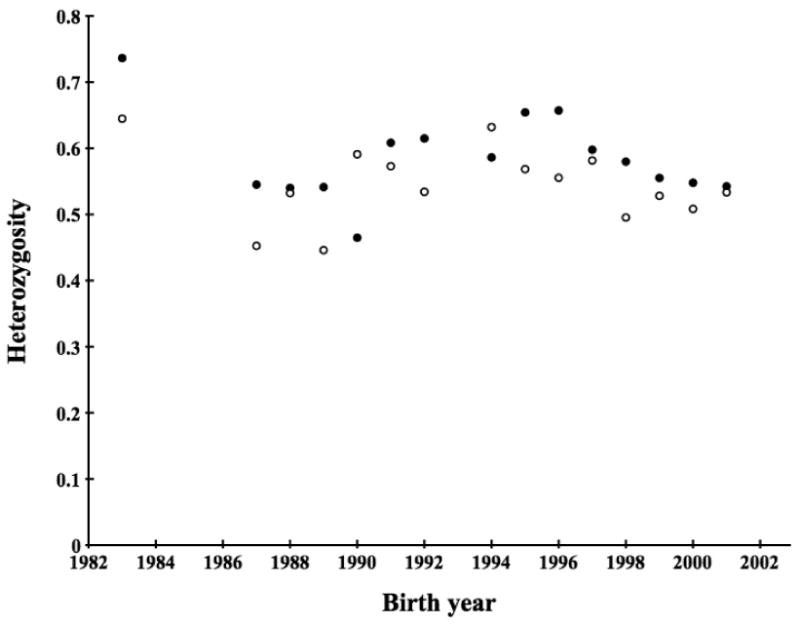
Observed and simulated average heterozygosity for cohorts within the Scandinavian wolf population. Open circles are average heterozygosities per birth year for wolves in the data set. Filled circles are simulated average heterozygosity.

Observed and simulated average heterozygosity for cohorts within the Scandinavian wolf population. Open circles are average heterozygosities per birth year for wolves in the data set. Filled circles are simulated average heterozygosity.