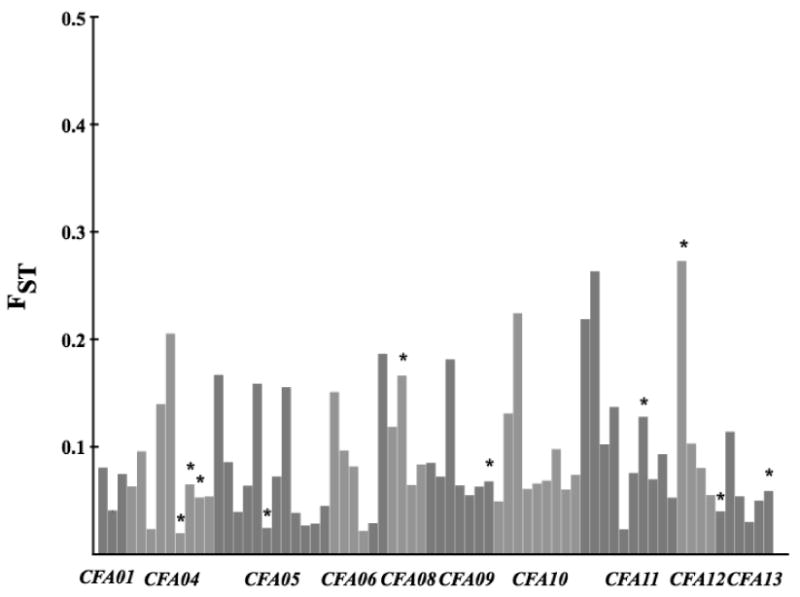
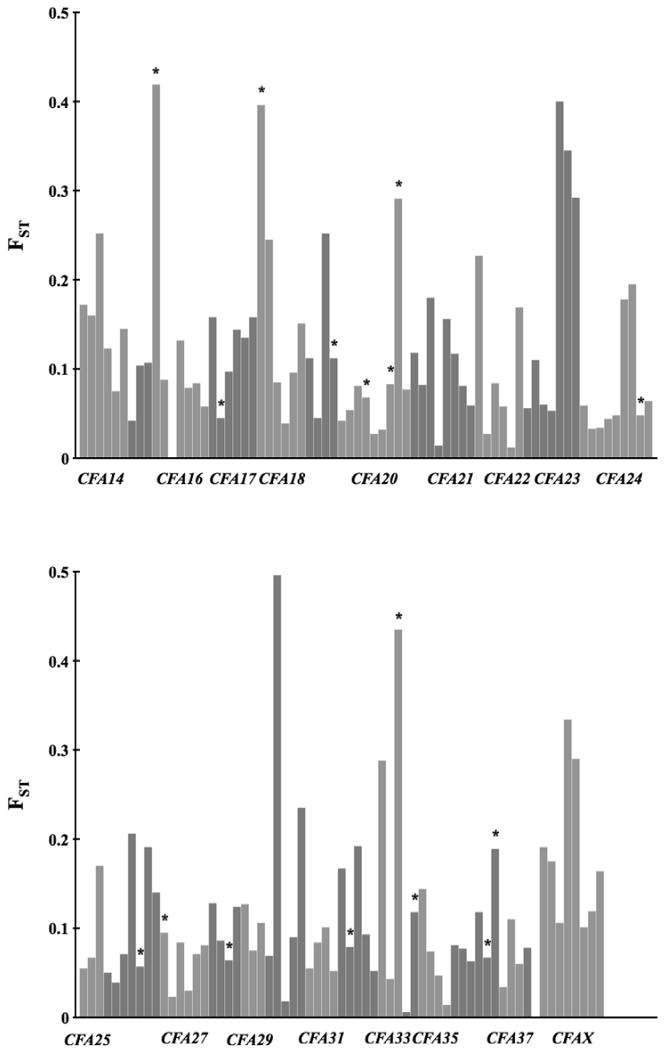
Figure 6.


FST for all markers estimated in the comparison of Scandinavian and Russian wolves. Markers from different chromosomes are given in alternating colors. * denotes loci with FST values outside of 95 % confidence intervals from simulated FST values.
